SWD Protocolos compatibles
Sistemas embebidosSerial Wire Debug
¿Qué es SWD?
SWD (Serial Wire Debug) is a two-pin debug interface defined by ARM as part of the CoreSight debug architecture. SWD provides the same debug functionality as JTAG — register access, memory read/write, breakpoints, and trace — using only two pins: SWDIO (bidirectional data) and SWCLK (clock). SWD is the standard debug interface for ARM Cortex-M, Cortex-A, and Cortex-R processors, making it ubiquitous in microcontroller and embedded processor designs. Engineers analyzing SWD traffic can verify that debug probes are communicating correctly with the target, diagnose firmware download failures, and debug low-level hardware access issues that manifest as SWD read/write errors or WAIT responses from the debug access port.
SWD Referencia rápida
| type | Serial, synchronous |
| signals | SWDIO, SWCLK |
| max Speed | Up to 50 MHz |
| voltage Range | 1.8V – 3.3V |
| features | ARM debug interface |
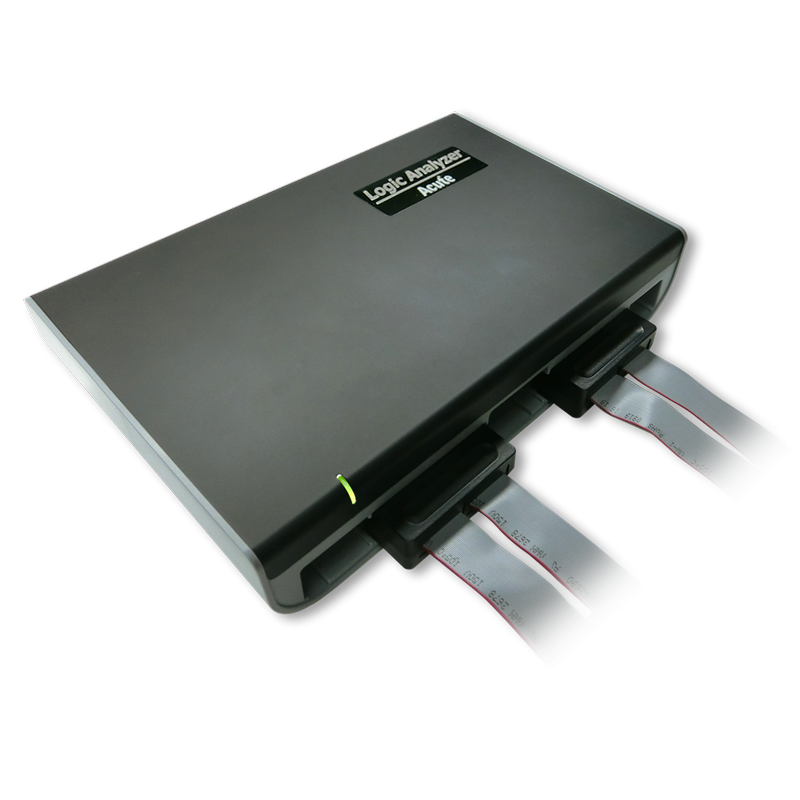
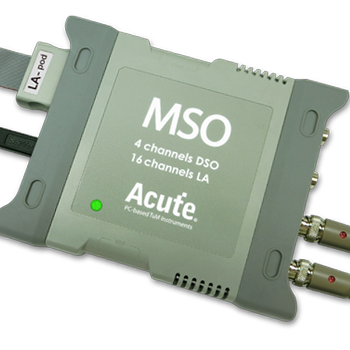
Instrumentos Acute compatibles con SWD
Soluciones recomendadas
Recomendado para decodificación

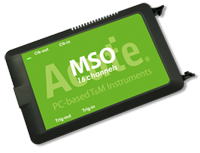
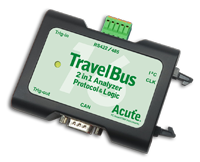
TB3016F
only decode
Con canales analógicos
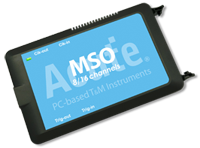
MSO2116E
only decode
Todos los productos compatibles

¿Listo para analizar este protocolo?
Vea cómo los instrumentos Acute capturan y decodifican este protocolo en tiempo real. Solicite una demo o contacte a nuestro equipo.
¿Cómo analizar SWD con instrumentos Acute
Conecte su analizador lógico Acute a los pines SWDIO y SWCLK en el conector de depuración del objetivo (típicamente un conector Cortex Debug de 10 pines).
Conecte un cable de tierra a la referencia de tierra de la placa objetivo.
En el software Acute, seleccione el SWD protocol decoder y asigne SWDIO y SWCLK a los canales de entrada correspondientes.
Configure el decodificador para expected clock speed and protocol versión.
Capture y visualice los SWD transactions showing request packets (APnDP, RnW, address), acknowledgment (OK, WAIT, FAULT), and data phases for debug port register access.