SWD Protocol Support
Embedded SystemsSerial Wire Debug
What is SWD?
SWD (Serial Wire Debug) is a two-pin debug interface defined by ARM as part of the CoreSight debug architecture. SWD provides the same debug functionality as JTAG — register access, memory read/write, breakpoints, and trace — using only two pins: SWDIO (bidirectional data) and SWCLK (clock). SWD is the standard debug interface for ARM Cortex-M, Cortex-A, and Cortex-R processors, making it ubiquitous in microcontroller and embedded processor designs. Engineers analyzing SWD traffic can verify that debug probes are communicating correctly with the target, diagnose firmware download failures, and debug low-level hardware access issues that manifest as SWD read/write errors or WAIT responses from the debug access port.
SWD Quick Reference
| type | Serial, synchronous |
| signals | SWDIO, SWCLK |
| max Speed | Up to 50 MHz |
| voltage Range | 1.8V – 3.3V |
| features | ARM debug interface |
Acute Instruments Supporting SWD
Recommended Solutions
Recommended for Decode

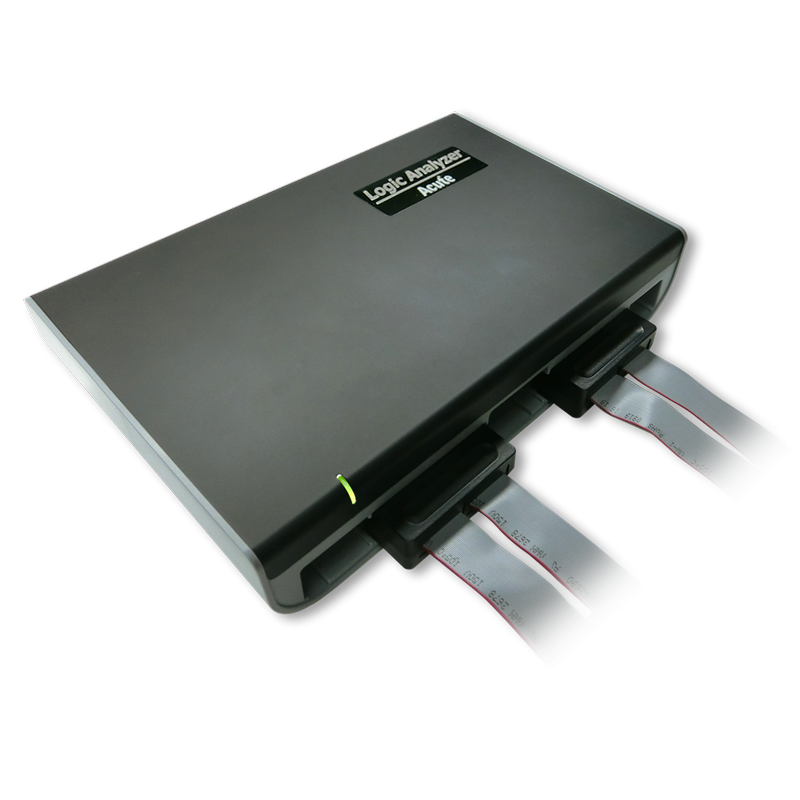
TB3016F
only decode
With Analog Channels
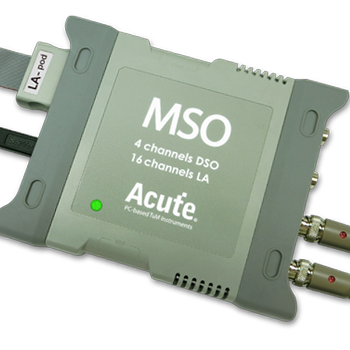
MSO2116E
only decode
All Supporting Products

Ready to analyze this protocol?
See how Acute instruments capture and decode this protocol in real time. Request a demo or contact our team.
How to Analyze SWD with Acute Instruments
Connect your Acute logic analyzer to the SWDIO and SWCLK pins on the target's debug header (typically a 10-pin Cortex Debug connector).
Attach a ground lead to the target board's ground reference.
In the Acute software, select the SWD protocol decoder and assign SWDIO and SWCLK to the correct input channels.
Configure the decoder for the expected clock speed and protocol version.
Capture and view decoded SWD transactions showing request packets (APnDP, RnW, address), acknowledgment (OK, WAIT, FAULT), and data phases for debug port register access.